The Grassland Butterfly Index, also known as the Grassland Butterfly Indicator or GBI, is an indicator of grassland ecosystem health based on population trends of 17 grassland butterfly species. It was first proposed as an indicator of European biodiversity by Van Swaay and Van Strien in 2005, and is currently recognised as a robust indicator of agricultural ecosystem health through EU policy.
In this tab, you will find comprehensive information about this indicator, including:
Fluctuations in butterfly populations may provide valuable information about the environments they inhabit, as they are highly sensitive to changes , such as in local plant diversity, temperature and humidity. The Grassland Butterfly Index is based on this principle, deriving from population trends of 17 select grassland butterfly species.
The characteristics of these 17 species of butterflies (‘GBI species’) make the GBI a good indicator for grassland ecosystem health in the European region:
All 17 species have a broad distribution across Europe. As abundance data is obtained for these species across Europe, it is possible to use this indicator at the European or EU27 level.
10 of the 17 species are specialists, meaning they require very specific environmental conditions to thrive. Their populations are especially sensitive and thus reflect short-term environmental change. These are: Erynnis tages, Thymelicus acteon, Spialia sertorius, Cupido minimus, Phengaris arion, Phengaris nausithous, Lysandra bellargus, Cyaniris semiargus, Lysandra coridon and Euphydryas aurinia.
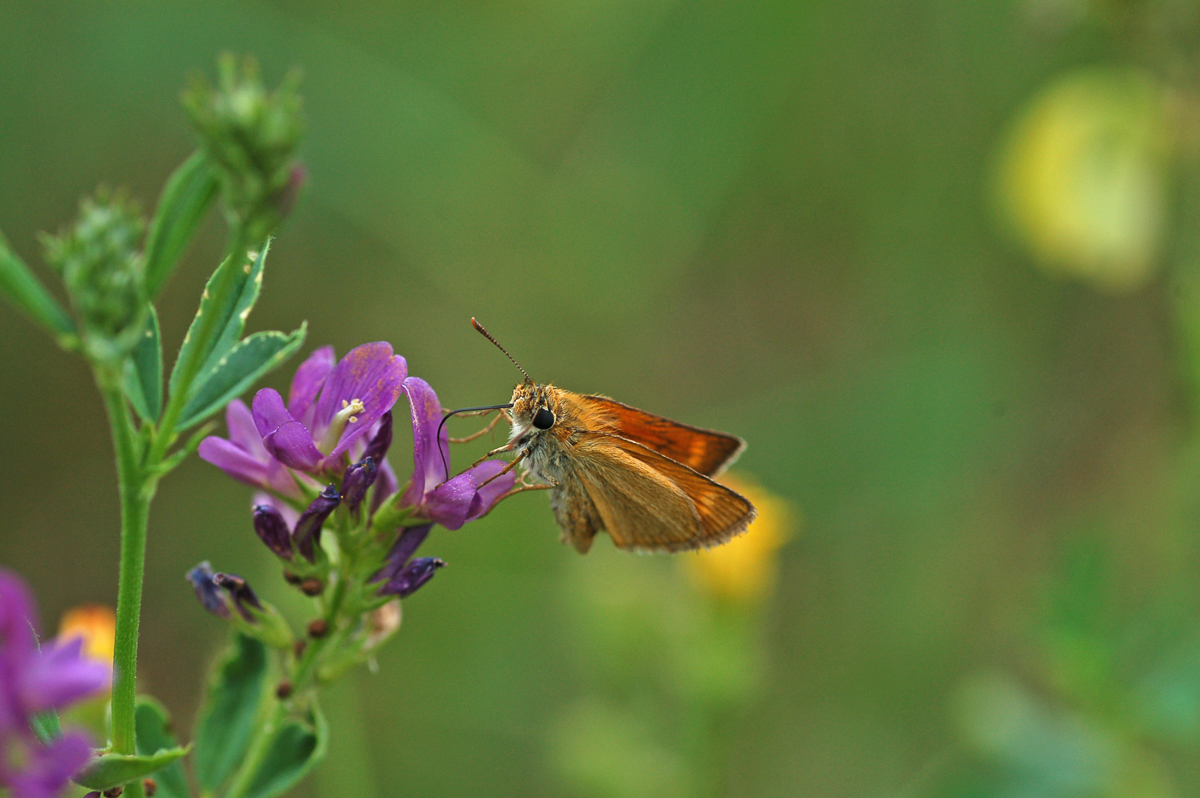
GBI Specialist Species: Erynnis tages
GBI Specialist Species: Thymelicus acteon
GBI Specialist Species: Spialia sertorius
GBI Specialist Species: Cupido minimus
GBI Specialist Species: Phengaris arion
GBI Specialist Species: Phengaris nausithous
GBI Specialist Species: Lysandra bellargus
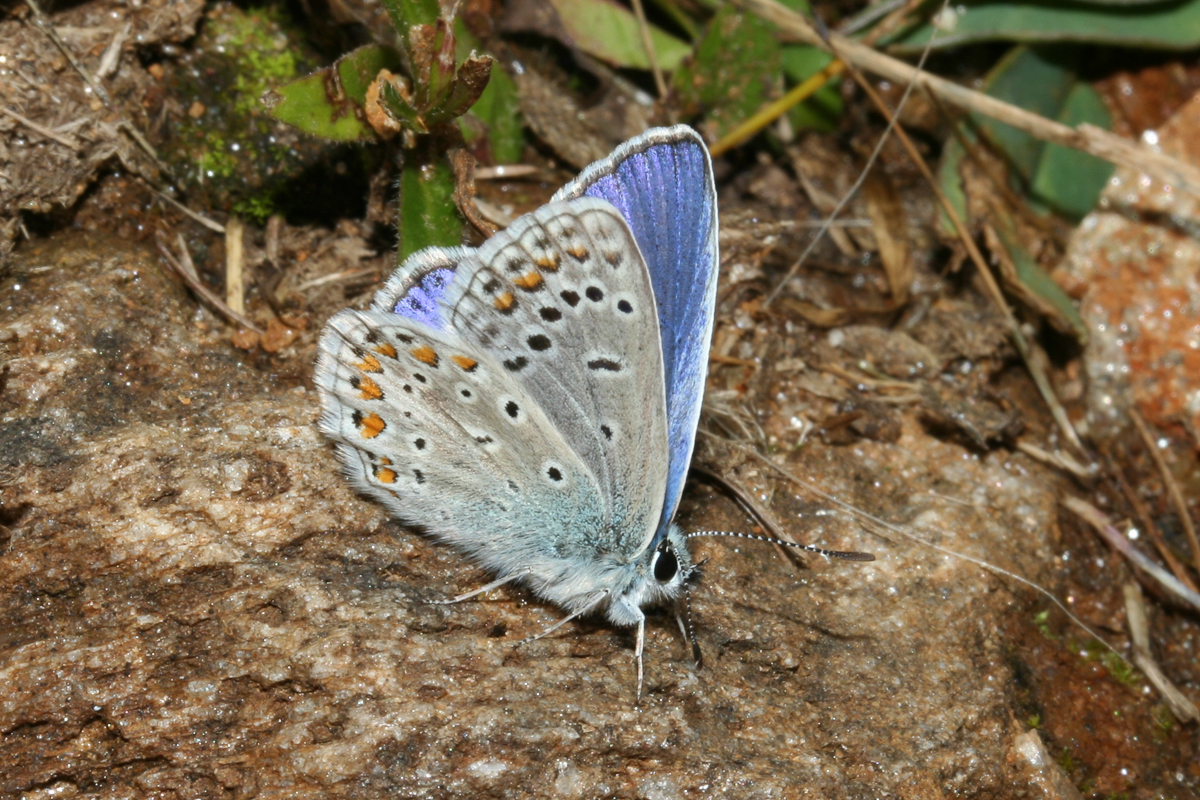
GBI Specialist Species: Cyaniris semiargus
GBI Specialist Species: Lysandra coridon
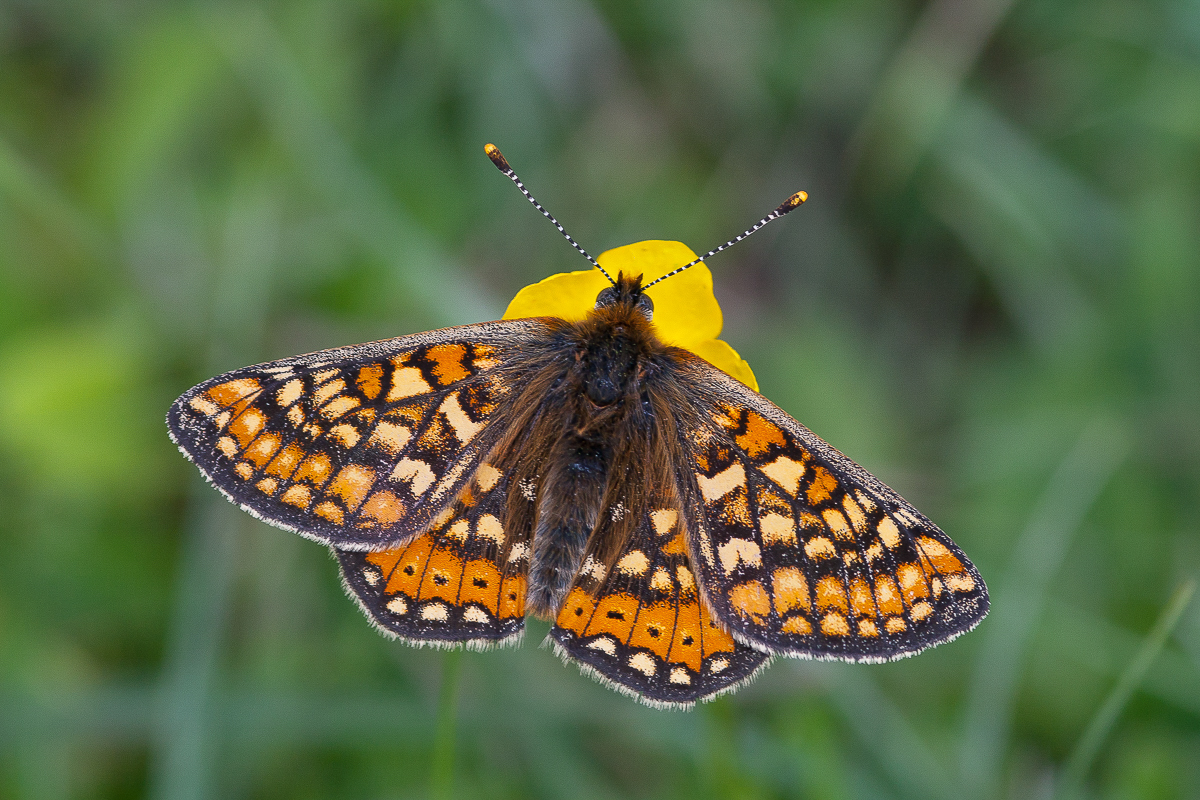
GBI Specialist Species: Euphydryas aurinia
7 of the 17 species are widespread generalists, meaning they thrive across a broad range of environmental conditions. They are more common and account for the bulk of the data used to calculate the GBI, thereby strengthening the indicator. These are: Ochlodes sylvanus, Anthocharis cardamines, Lycaena phlaeas, Polyommatus icarus, Lasiommata megera, Coenonympha pamphilus and Maniola jurtina.
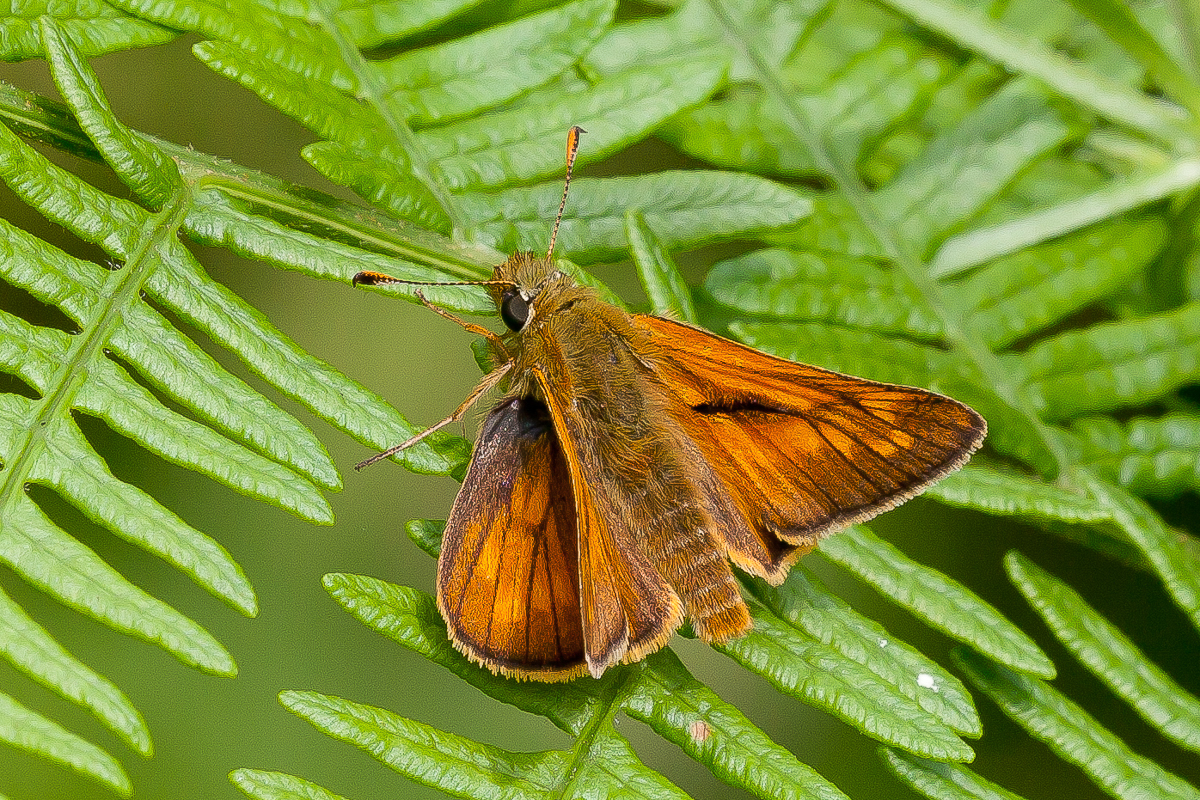
GBI Generalist Species: Ochlodes sylvanus
GBI Generalist Species: Anthocharis cardamines
GBI Generalist Species: Lycaena phlaeas
GBI Generalist Species: Polyommatus icarus
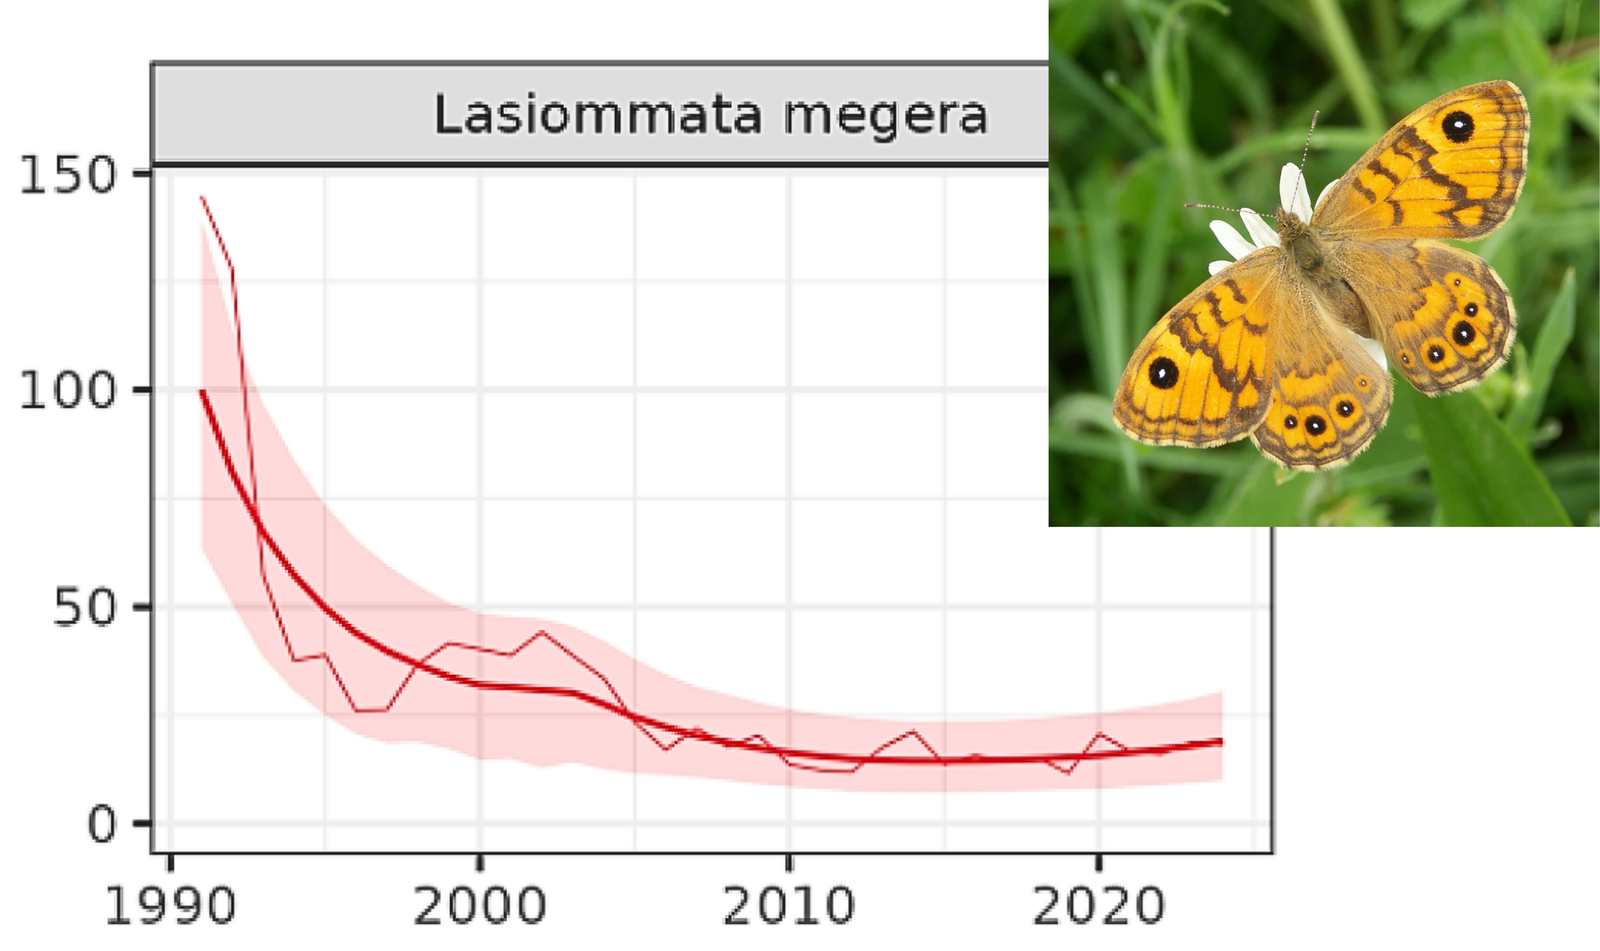
GBI Generalist Species: Lasiommata megera
GBI Generalist Species: Coenonympha pamphilus
GBI Generalist Species: Maniola jurtina
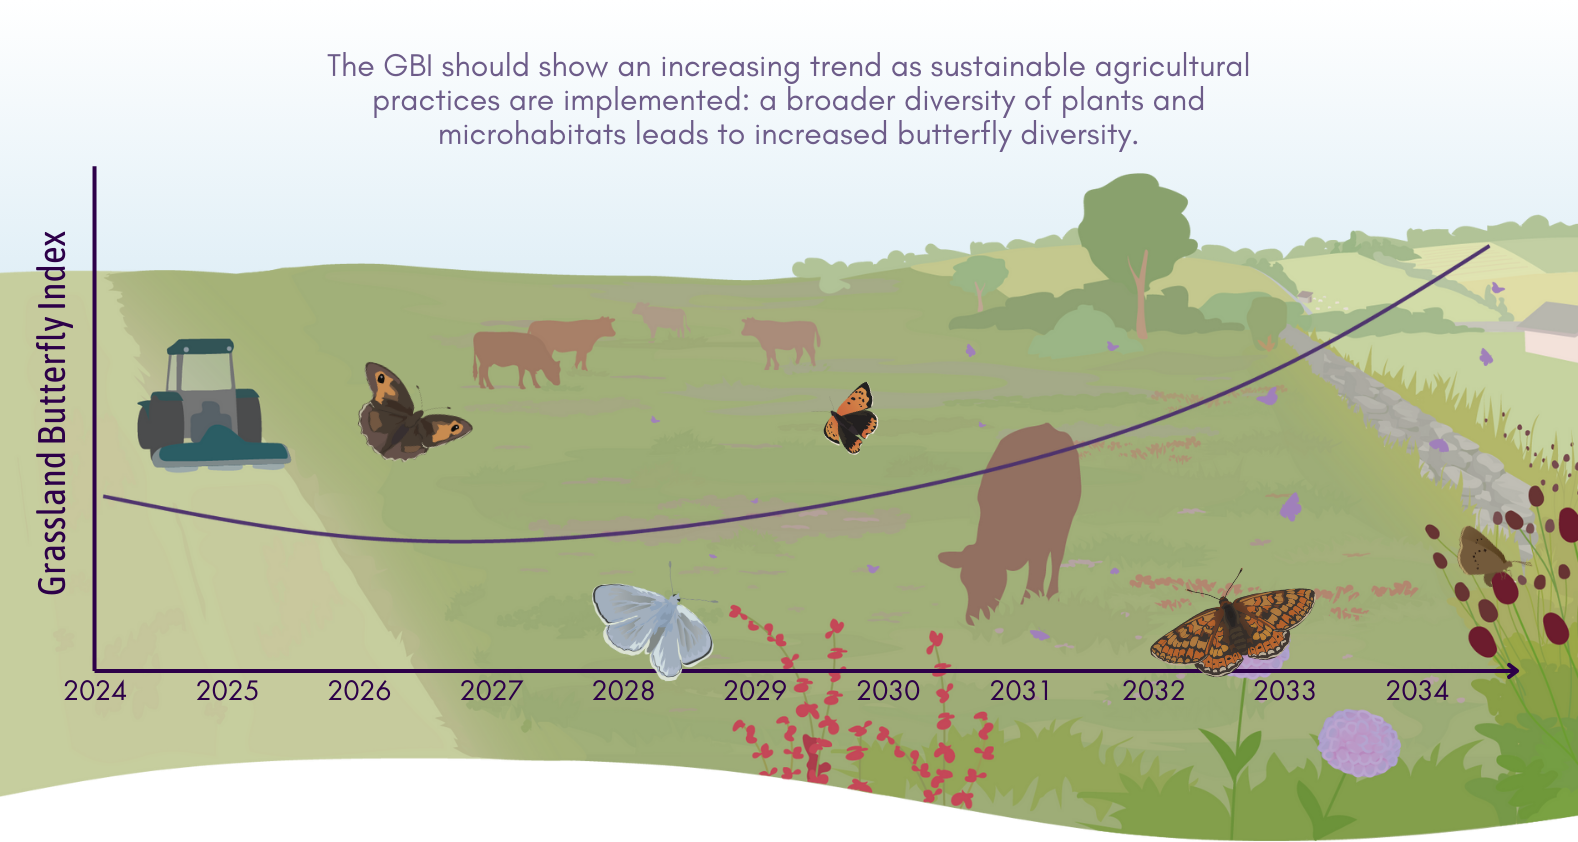
The Grassland Butterfly Index is considered a robust indicator of agricultural ecosystem health because agricultural practices are closely linked to the well-being of grasslands. Conversion of grasslands to cropland along with unsuitable land management or abandonment contributes to the loss of the plant and microhabitat diversity that grassland butterflies require to thrive. Thus, implementing sustainable agricultural practices that lead to higher biodiversity in agricultural ecosystems would be reflected as an increase in the GBI over time. You can find suggestions on such habitat management measures in the Bending the Curve of the Grassland Butterfly Index and Basic Principles for Managers pages.
Illustration by Laura Habit
How it is calculated
The following section describes a highly simplified description of the indicator's calculation. To learn about the process in depth, please read the latest EU Grassland Butterfly Index Technical Report, which may be found below on this page, in the section ‘Its trends over the years’ .
The Grassland Butterfly Index is calculated using butterfly count data gathered through Butterfly Monitoring Schemes (BMSs).
Butterfly Conservation Europe and UKCEH created eBMS, the European Butterfly Monitoring Scheme, a unified network of BMSs that serves as a hub for data collected by BMSs across Europe and, more recently, the rest of the world. As of 2026, eBMS has one or more partnered BMSs from 36 countries and territories in Europe, including all EU Member States.
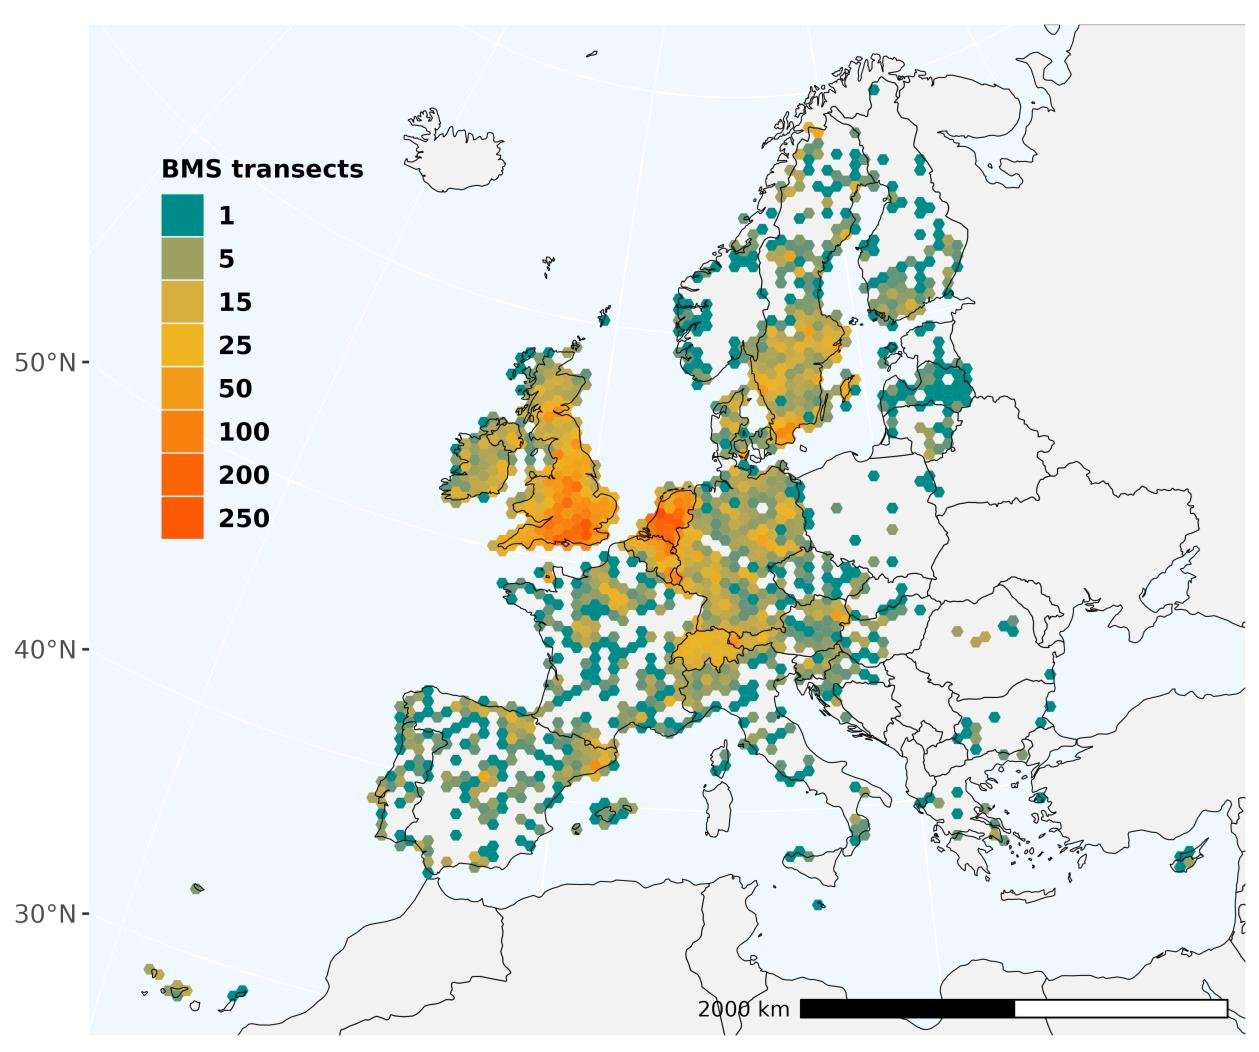
The map shows the density of Butterfly Monitoring transects visited per 50km grid across all European schemes that have contributed to the eBMS database (as of v7, up to the late 2024 season). Densities are calculated from sites that have been visited at least once since 1990.
Each BMS is led by one or more trained coordinators who guide citizen-science volunteers across their country to identify and count butterflies along set transects multiple times a year (Pollard Walks). The data is validated, and the reported sightings of the 17 GBI species are then used:
The gathered records are used to estimate butterfly flight curves for each of the 17 species, separately.
For each of the 17 species, an index is calculated for each transect and year (‘annual site index’).
From these indices, a collated index for the monitoring scheme (the union of the country’s transects) is calculated for each species.
Then, one of the following paths is taken:
To obtain a country-level GBI, like that mandated by Article 11(2) of the Nature Restoration Regulation*, an unweighted mean of the collated indices for all species is calculated.
To obtain a European or EU 27-level GBI, a supra-national collated index is calculated for each of the 17 species using a weighted geometric mean that accounts for each monitoring scheme’s area. Only then is the unweighted mean of all 17 species calculated.
By consistently collecting data over time and following these steps, it is possible to observe species population trends or Grassland Butterfly Index trends at the country level or at a broader EU27 or European level.
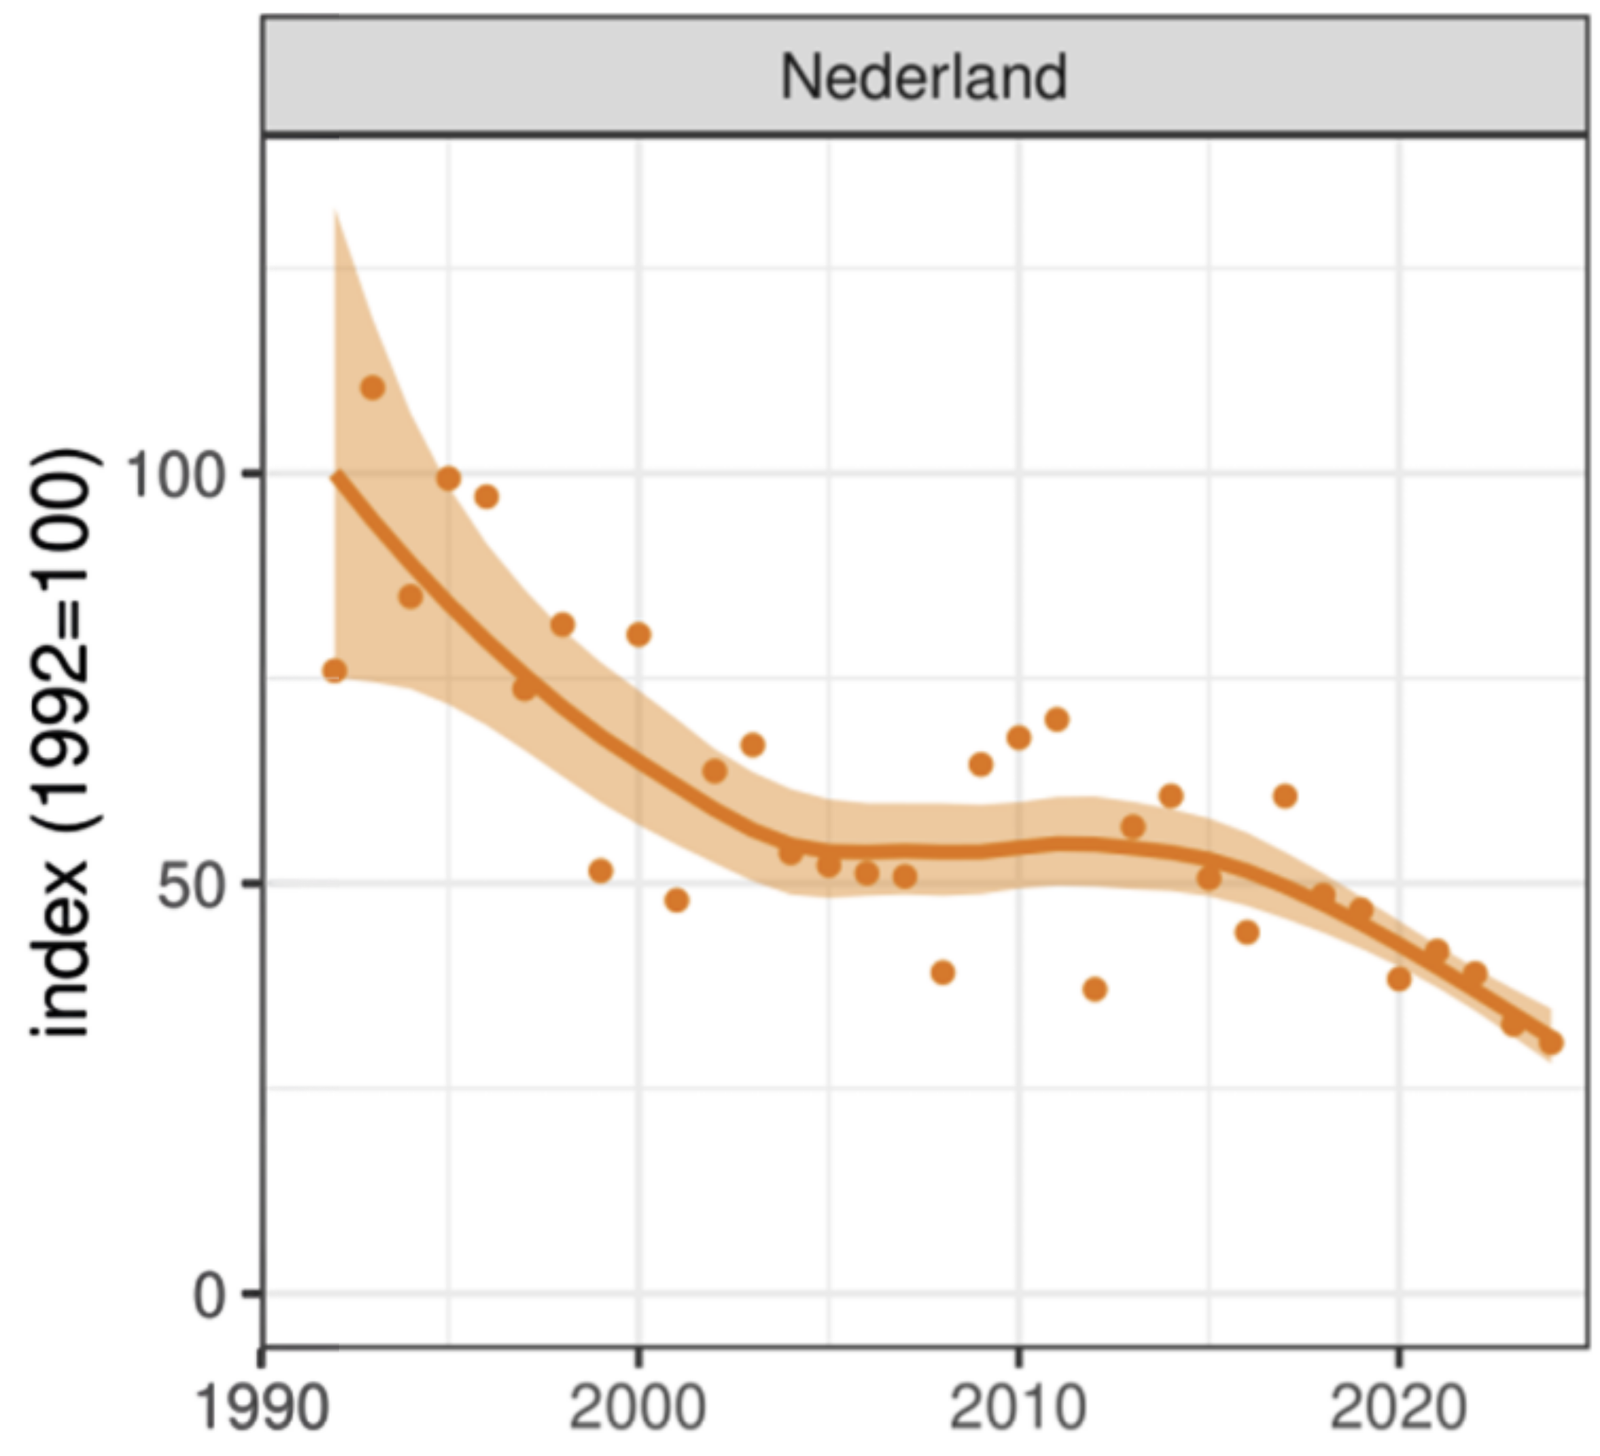
Grassland Butterfly Index for the Netherlands, 1992-2024. Modified from Laan, A. van der & Swaay, C.A.M. van (2025). Impactanalyse graslandvlinderindex. De Vlinderstichting, Wageningen, rapportnr. VS2025.022.
BCE and eBMS have made GBI calculation resources and support publicly available:
Statistical tools and full workshop
Reto Schmucki, Emily Dennis, David Roy, and Chris Van Swaay held the Calculating butterfly trends, indices and indicators workshop in April 2020. The R code and full explanation are publicly available:
The Grassland Butterfly Index is recognised as both a valid measure of pollinator decline and an indicator of agricultural land health in various EU environmental and agricultural policy contexts.
The GBI is directly implemented or named in the following instances of EU policy:
Nature Restoration Regulation: The GBI is included as one of three valid agricultural ecosystem health indicators of Article 11(2).
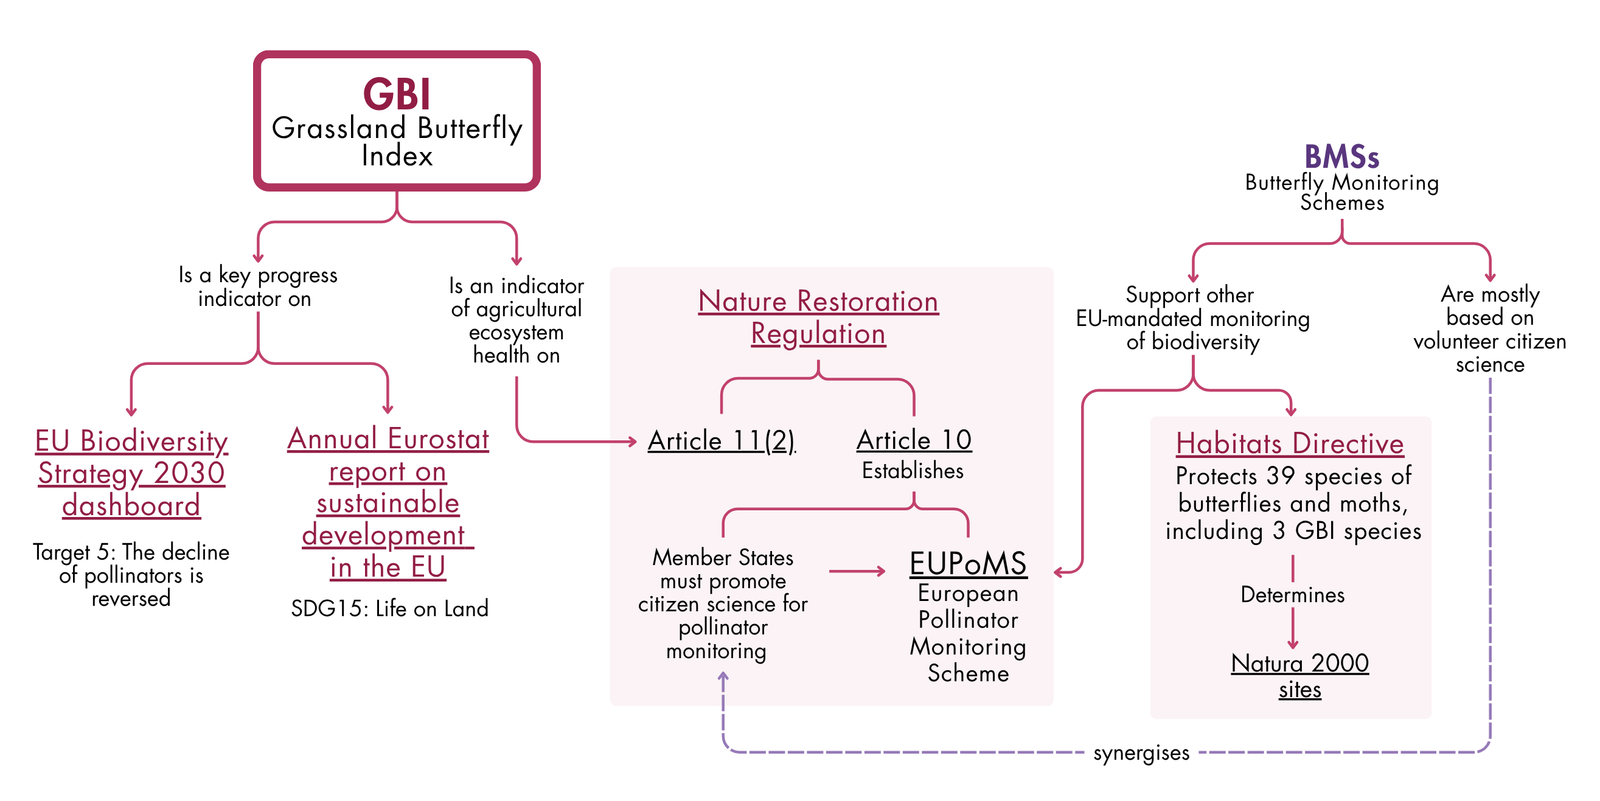
In addition to these instances, the monitoring of the Grassland Butterfly Indicator and the measures required to increase its trends strongly synergise with multiple other instances of EU policy:
EU Policy synergies of monitoring the Grassland Butterfly Index
Furthermore, the continued monitoring of the GBI is supported by EU funding. The development of butterfly monitoring schemes in EU Member States, which makes it possible to obtain the data needed to consistently and accurately calculate the EU27 GBI, has been enabled by EU-funded projects:
In 2018-20, DG-ENV funded the ABLE project, which enabled BCE to establish new Butterfly Monitoring Schemes in 10 EU Countries.
In 2021-23. DG-ENV funded the SPRING project, which enabled BCE to establish new Butterfly Monitoring Schemes in 6 EU Countries.
Project EMBRACE is in effect in 2025-26 and aims to update the European butterfly indicator and build capacity to support eBMS across Europe.
Its trends over the years
Butterfly Conservation Europe has published several official EU Butterfly Indicator for Grassland species Technical reports, updating the European and EU-level GBI trends with new BMS data, and sharing EU-level population trends for the 17 select GBI butterfly species.
The latest BCE Technical report, the EU Grassland Butterfly Index 1991-2024 Technical report, showed that the EU27-GBI has declined by 47% since 1991. This report provides an essential message from scientists to policymakers: butterflies are still declining at an alarming rate across the EU, and urgent action is required to protect and restore habitats to reverse this trend, not only for butterflies but also for other wild insect pollinators and their ecosystem services.
The Grassland Butterfly Indicator (smooth line) through annual index (points) calculated for the EU27 countries (left) and broader Europe (right) from 1991 to 2024. The shaded area represents the 95% CI of the smoothed trend.
In the list below, you can find all published technical reports, from latest to oldest:
In addition to the reports listed above, BCE published the Assessing Butterflies in Europe - Butterfly Indicators 1990-2018 Technical report in 2020, which includes information on other butterfly-based indicators. Note that this is the technical report used to define the methodology of the GBI in the Nature Restoration Regulation.










 ) (published in 2025)